
KEY TAKEAWAYS
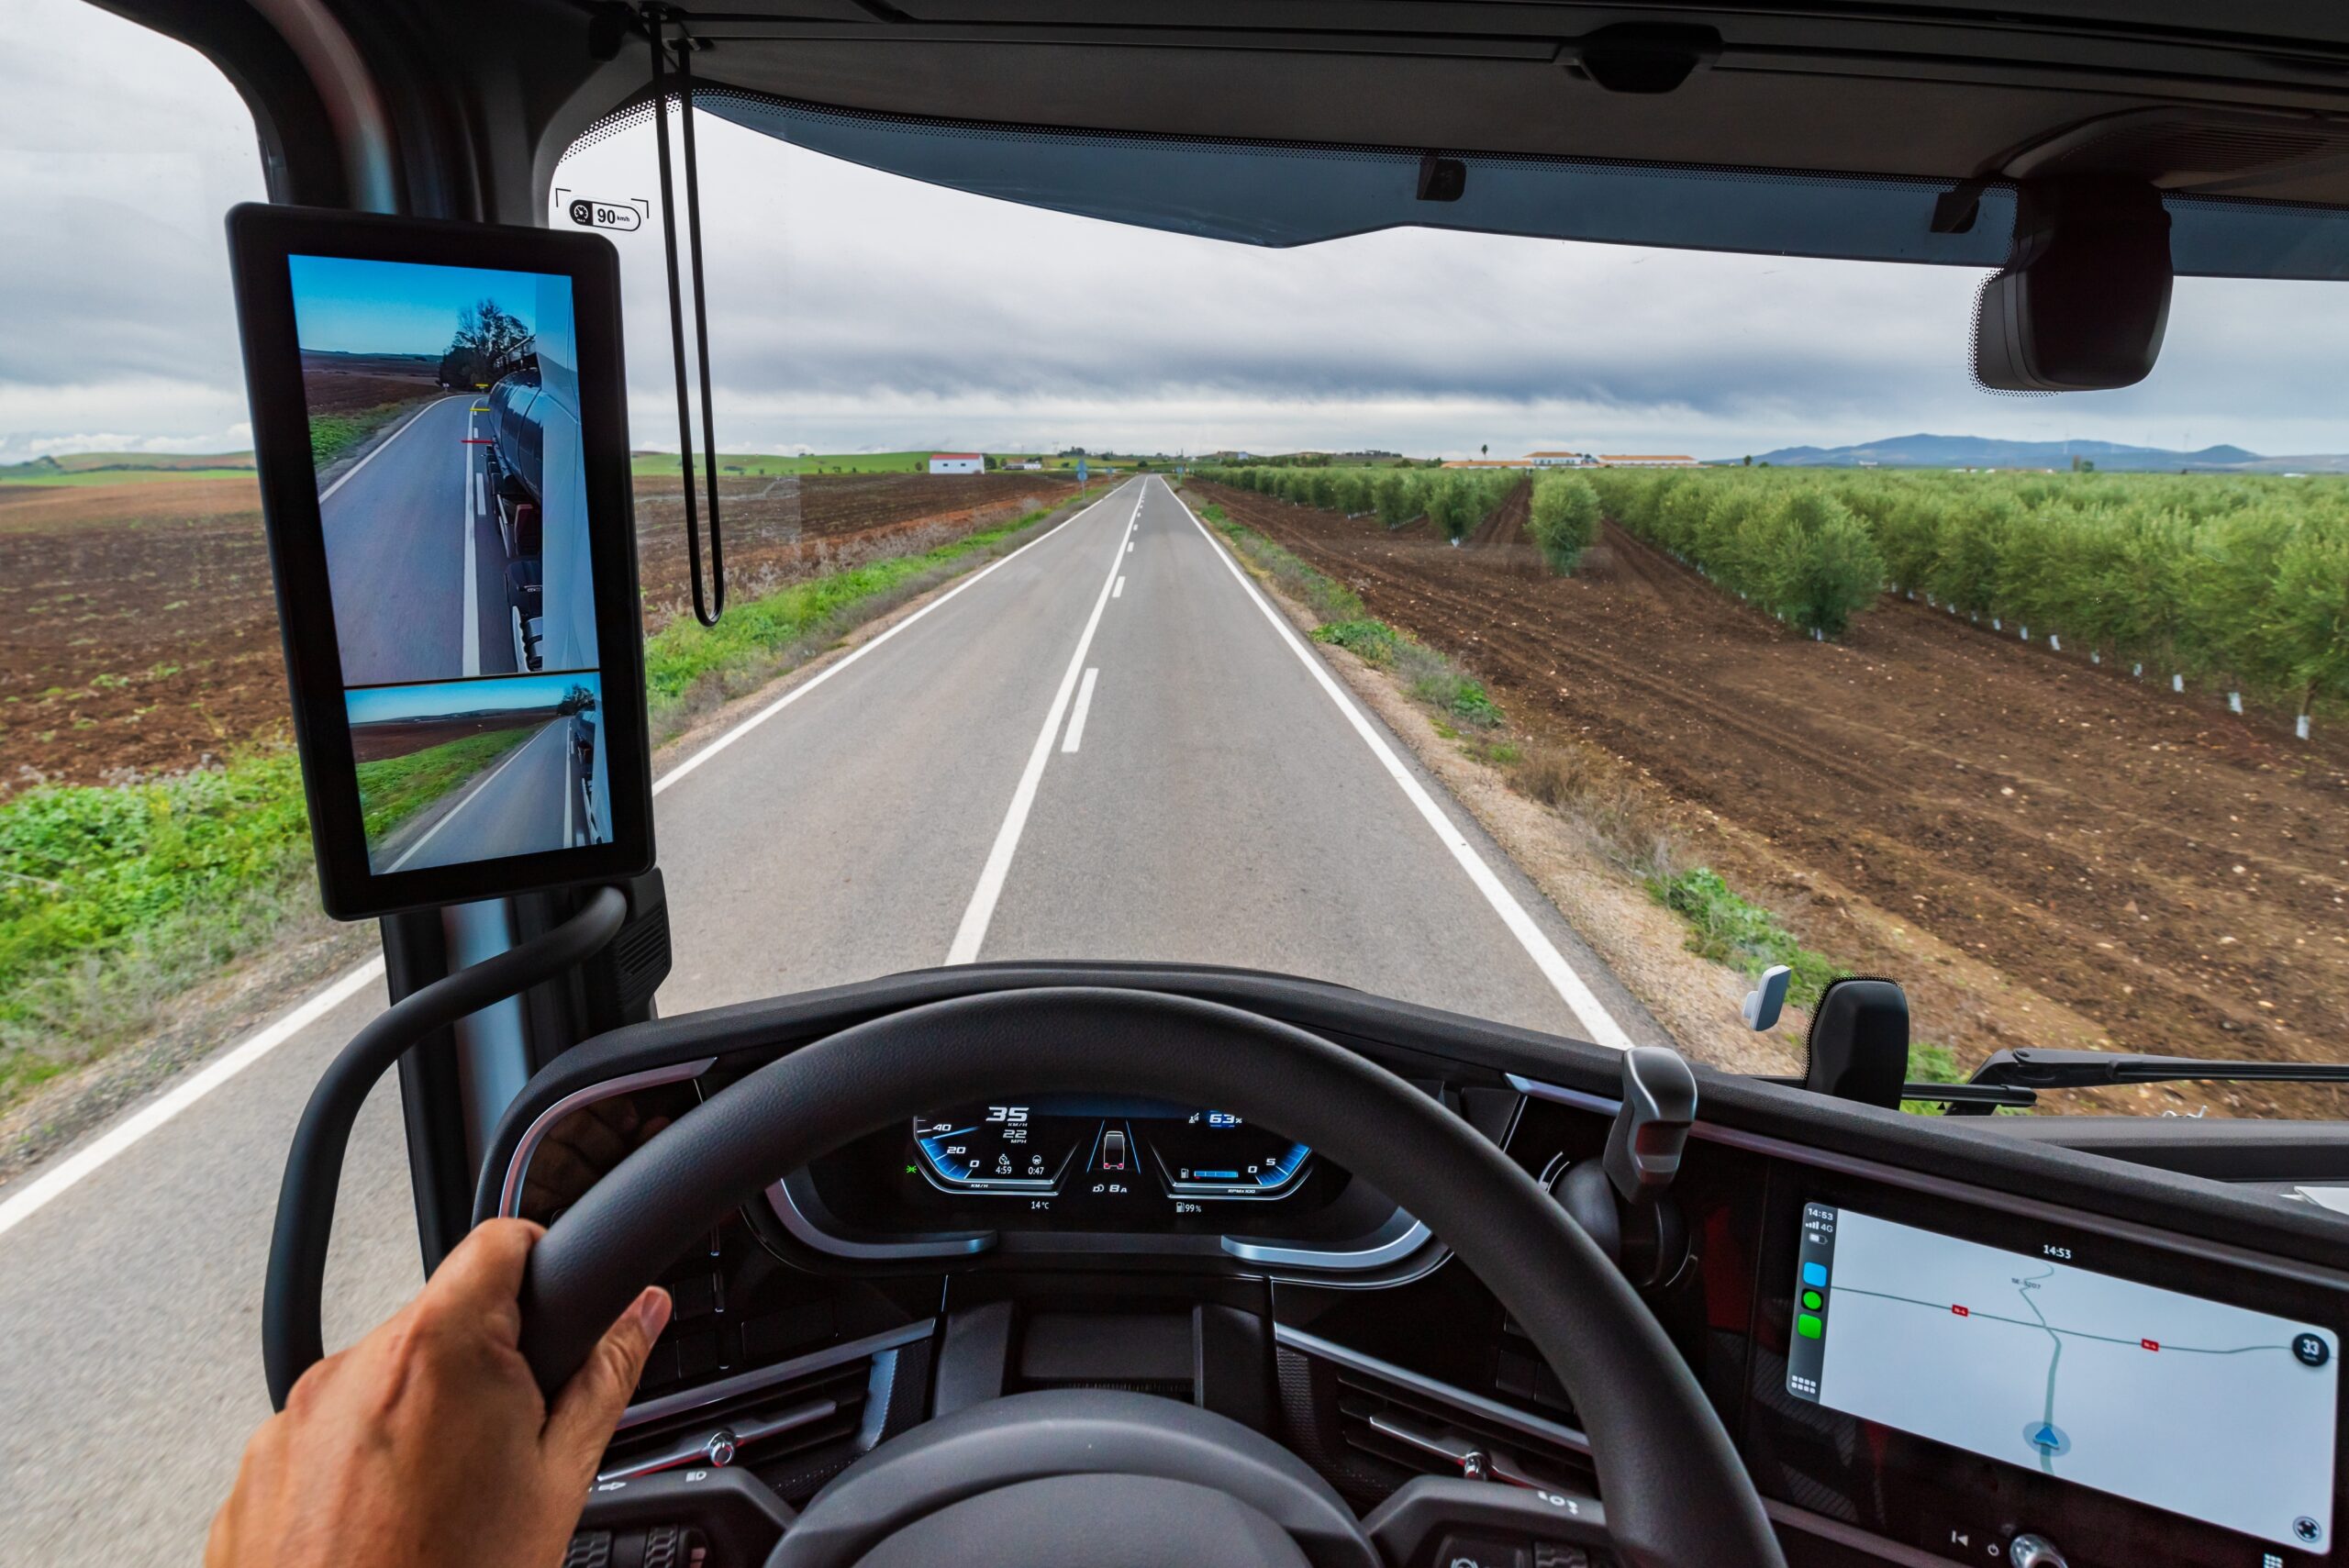
Vehicle fleet tracking helps businesses improve visibility using GPS and telematics to monitor operations in real-time. With geofencing, fleet managers can track activity across depots, delivery locations, and routes, making it easier to manage movement and reduce delays. As part of modern fleet management, these tools help teams respond faster and make better decisions. Learn more about how vehicle tracking, geofencing, and real-time insights are used across fleet operations.
Fleet accidents rarely end at the repair bill.
In most cases, the visible damage is just the starting point. A dented bumper or a cracked axle shows up on an invoice, but the bigger costs build quietly in the background. Insurance premiums increase and stay elevated for years. Vehicles sit idle while deliveries continue to stack up. Drivers get reassigned, and schedules start slipping.
The issue is not that fleets are unaware of accident costs. It is that these costs are often measured in isolation. Repair expenses are tracked. Claims are processed. But the downstream impact across operations, insurance, and customer relationships is rarely viewed as a single, compounding problem.
That gap is where the real financial impact sits. A single incident does not just affect one vehicle. It affects revenue flow, driver availability, service reliability, and how insurers and clients evaluate the business going forward.
Over time, this turns into a pattern. What looks like a few isolated incidents starts driving higher operating costs, tighter margins, and increased scrutiny from insurers.
This blog breaks down where fleet accident costs actually come from, how they compound across different parts of the operation, and what fleets can do to reduce their long-term impact.
What if you could know where every vehicle in your fleet is, in real-time, and even anticipate delays or inefficiencies before they happen?
The direct costs are just the starting point
When a fleet vehicle is involved in a collision, the immediate expenses are easy to identify. Vehicle repair, towing, medical payments, and third-party property damage are recorded quickly and typically treated as the total cost of the incident.
Recent data from CCC Intelligent Solutions highlights how this view is incomplete. Their 2026 Crash Course report shows that repair costs and claim severity are continuing to rise, driven by factors like advanced vehicle components, higher labor costs, and longer repair cycles.
When a fleet vehicle is involved in a collision, the immediate expenses are easy to identify. Vehicle repair, towing, medical payments, and third-party property damage show up quickly and are usually well documented.
In reality, it is only the visible portion.
What follows is where the cost begins to scale. The vehicle is taken out of service, disrupting planned routes and revenue flow. Drivers need to be reassigned or replaced. Administrative time increases with claims processing, compliance checks, and internal reviews. Insurance exposure changes, which affects future premiums.
These costs do not appear as a single line item, but they accumulate across operations.
Downtime alone can significantly shift the economics of a single incident. A commercial vehicle generating $1,000 to $1,500 per day can lose $10,000 or more in revenue over a typical repair cycle, especially as repair timelines extend due to parts availability and increased vehicle complexity.
At the same time, the incident begins to influence future costs. Insurance exposure changes, which can lead to higher premiums at renewal. Operational disruptions affect service reliability, which can impact client retention over time.
A $20,000 incident on a delivery route rarely remains a $20,000 problem. By the time you account for lost revenue, operational adjustments, administrative overhead, and insurance impact, the total cost to the business can increase significantly beyond the initial repair expense.
The challenge is that these costs are rarely measured together. Because they are distributed across finance, operations, and risk, the full impact of an accident is often underestimated, making it harder for fleets to control it effectively.

Insurance: the cost that keeps compounding
This is where most fleet operators feel the impact longest. A single at-fault accident does not just trigger a claim payout. It changes how insurers assess risk across the entire operation at renewal.
Commercial auto insurance remains one of the most loss-sensitive segments in the transportation industry, primarily because it is directly tied to claim severity, liability exposure, and repair complexity. According to the Insurance Information Institute, commercial auto continues to face sustained pressure from higher claim costs and increasing loss volatility across the sector.
At the same time, litigation trends are adding further uncertainty. Research from the Swiss Re Institute highlights the impact of “social inflation,” where rising jury awards and larger liability claims are increasing the cost severity of accidents and making future losses harder to predict.
In practical terms, this changes how underwriting works. Insurance pricing is no longer based only on fleet size or historical averages. It increasingly reflects recent loss history, operational risk patterns, and the quality of safety data available at renewal.
This is why the impact of a single claim rarely stays contained to one year. A fleet that experiences an at-fault accident may see its risk profile reassessed, with the effect carrying forward across multiple renewal cycles until the loss history ages out.
The compounding effect comes from structure, not just pricing. Even when premium changes appear moderate in a single year, the cumulative impact over successive renewals creates a significantly higher long-term cost base for the fleet.
The practical outcome is clear. Fleets with weaker safety visibility tend to absorb higher long-term insurance costs, while operators that can demonstrate consistent safety performance through data are better positioned during underwriting reviews.
Downtime: the revenue you never recover
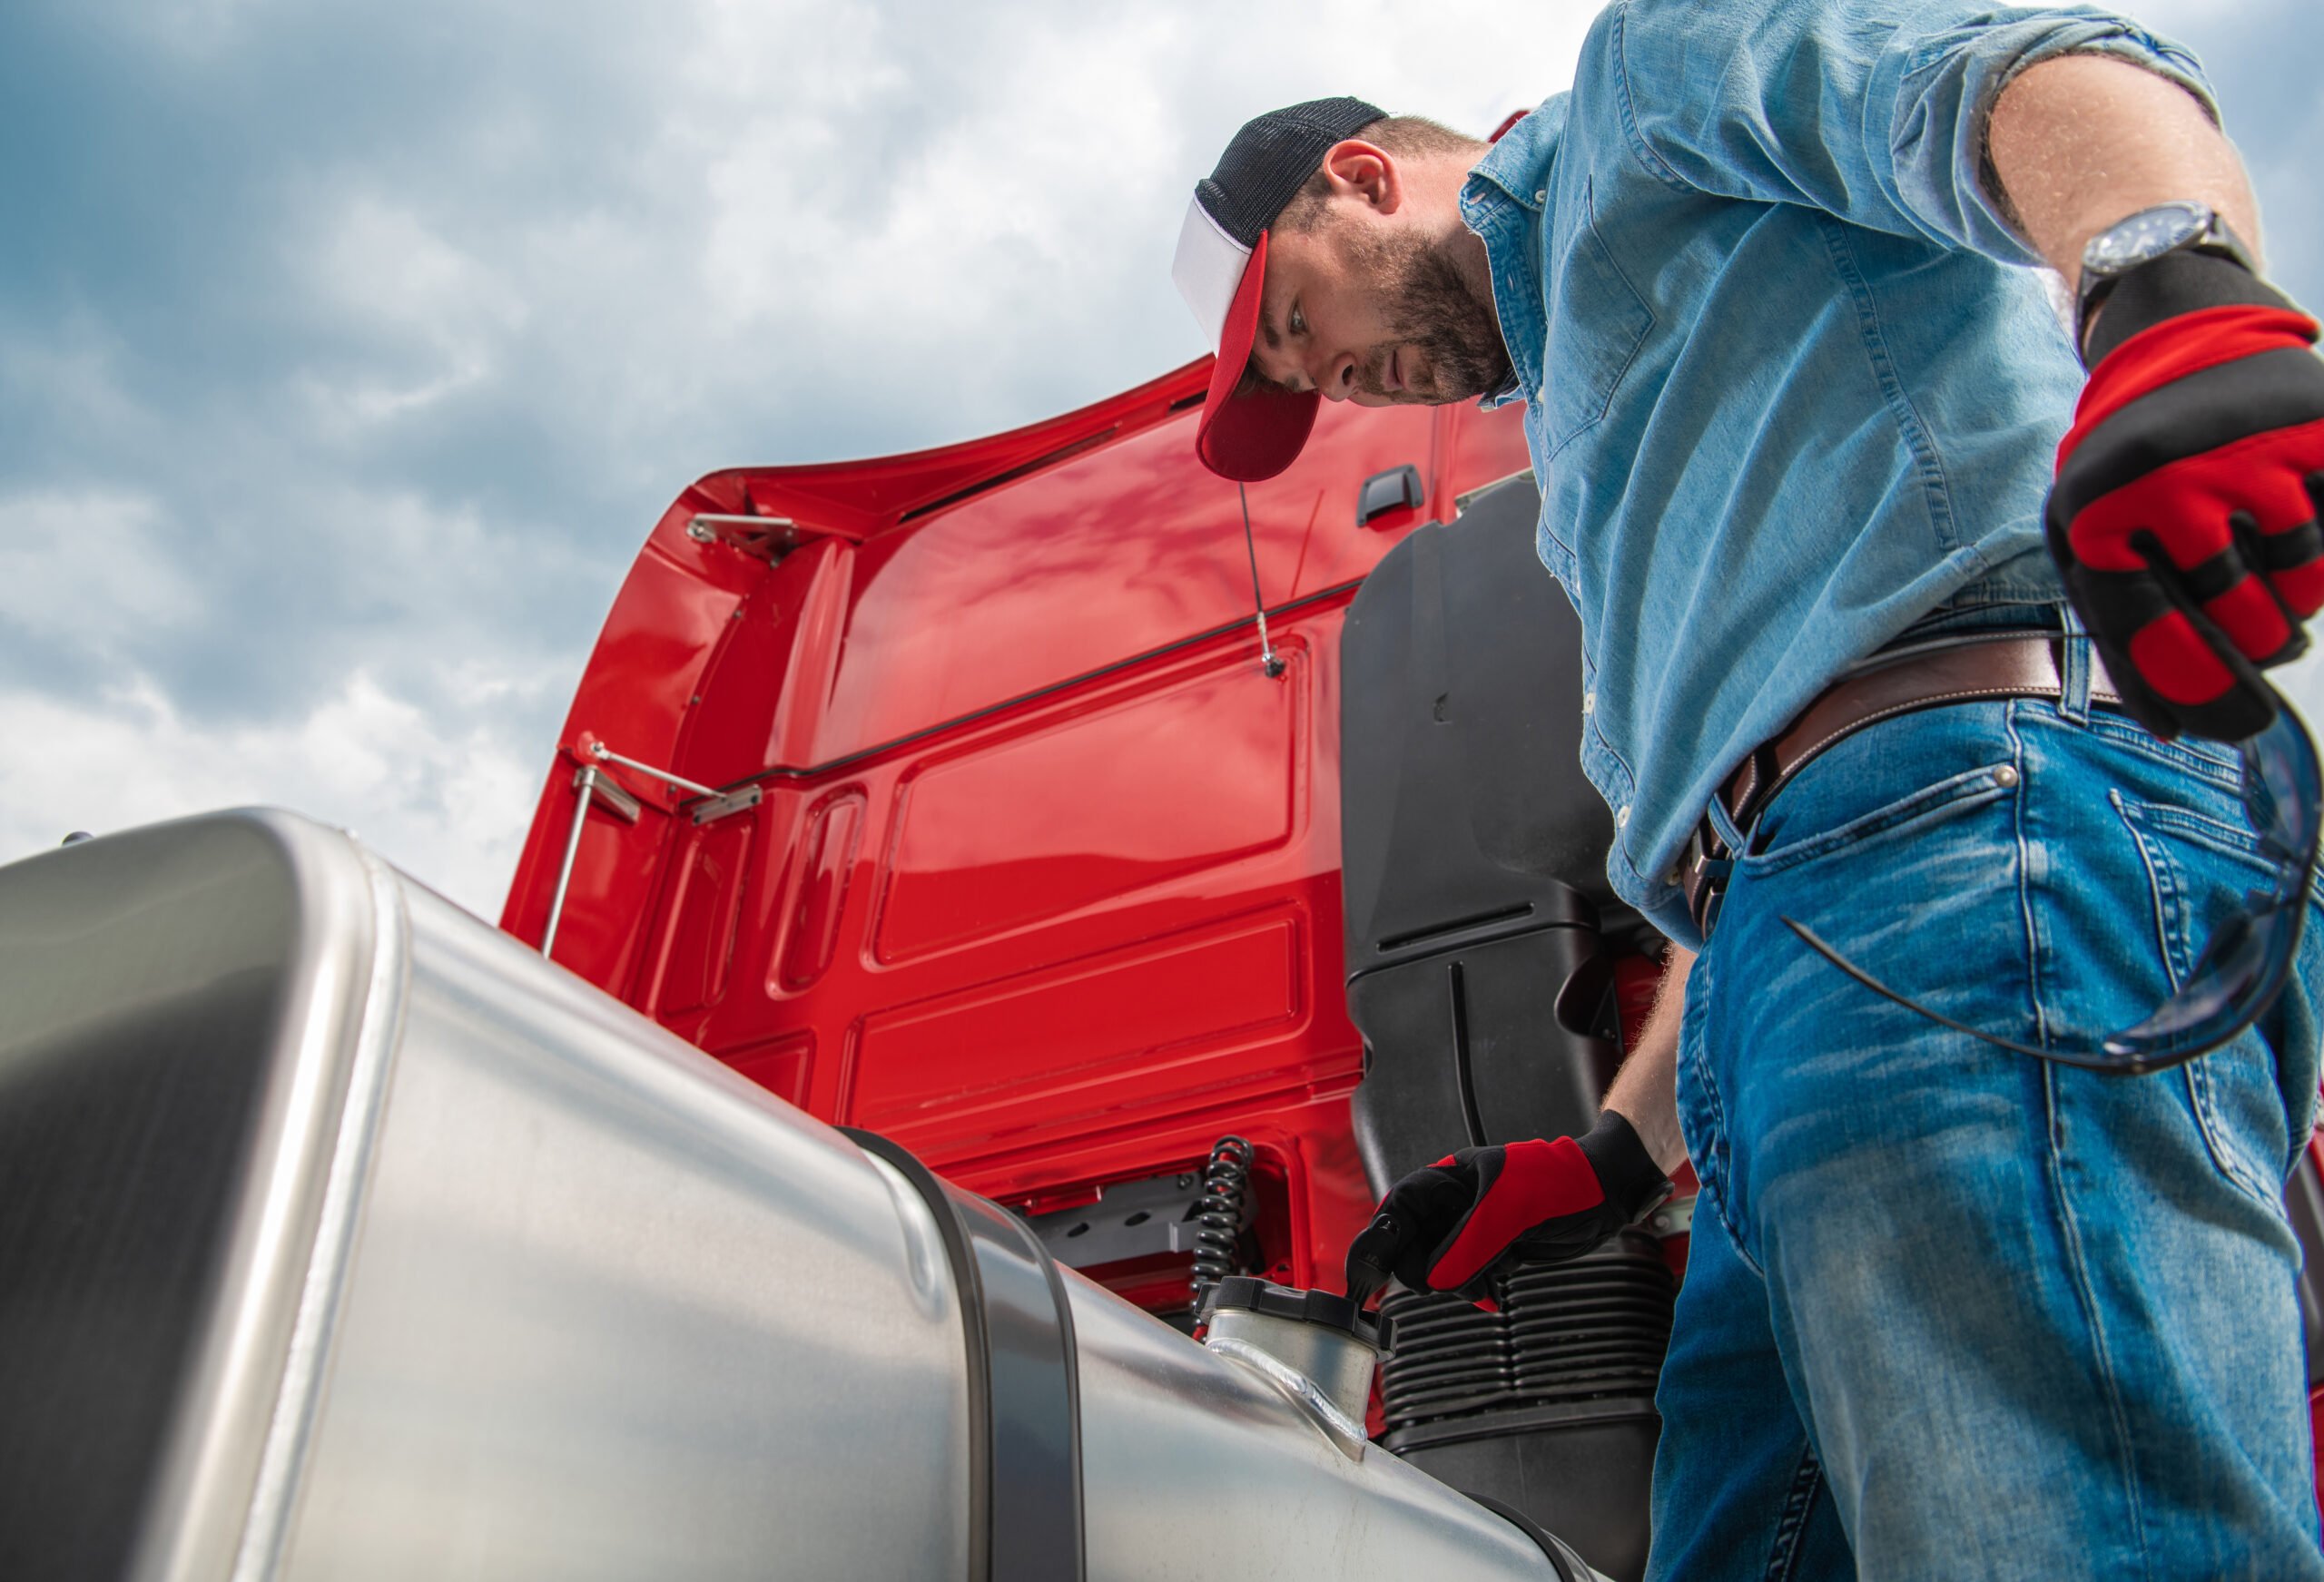
A truck in the shop earns nothing. While this is obvious, the real impact is often underestimated because fleets focus only on repair time, not the wider disruption.
When a vehicle goes out of service, routes are reshuffled, increasing mileage and fuel usage across the fleet. Drivers may be reassigned or pushed into overtime, and in capacity-constrained operations, deliveries can be delayed or declined.
Operational efficiency is highly sensitive to even small capacity losses, as highlighted in trucking research by the American Transportation Research Institute. At the same time, repair cycles have become less predictable due to parts availability and increasing vehicle complexity, as reflected in freight system performance data from the U.S. Bureau of Transportation Statistics.
The driver impact no one budgets for
A driver involved in a serious accident may be out of service for weeks due to recovery or medical leave. This creates an immediate gap that fleets must fill through reallocation, recruitment, or temporary adjustments in routing.
Even after returning, the impact is not always limited to availability. Confidence, driving consistency, and long-term retention can be affected, especially if the incident is perceived as preventable or linked to operational pressure.
In an already constrained driver market, even a small increase in attrition adds strain to scheduling and onboarding cycles.
There is also a significant administrative load. Each incident requires coordination across insurance, compliance, internal reporting, and safety review processes. This shifts internal focus from prevention to reaction.
This is where driver behavior monitoring systems like Intangles’ Driver Behavior Monitoring help close the gap, by identifying risk patterns early and enabling corrective action before incidents escalate.
Reputation: slow to build, fast to lose
Reputation rarely shows up as a direct cost, but its impact is very real in fleet operations.
In B2B logistics, clients assess partners based on reliability and safety performance. A pattern of incidents does not need to be formally flagged to influence decisions. It often surfaces later as “service issues” or non-renewal, even when the underlying concern is operational risk.
In a competitive market, fleets with rising accident frequency are quickly perceived as higher risk, which can affect renewals and long-term contracts without any explicit explanation.
For public-facing fleets such as last-mile delivery or transit, the exposure is even more direct. Incidents are increasingly visible, and a single video or report can spread quickly, shaping perception far beyond the original event.
What fleets can actually do about it
The costs outlined above are real, but they are not fixed. In most fleets, they are a direct result of visibility gaps across drivers, vehicles, and operations. Closing those gaps is what reduces both frequency and severity of incidents over time.
For most fleets, improvement does not come from one major change. It starts with identifying where risk is actually building and addressing it step by step across the operation.
Driver behavior monitoring is usually the first layer. It helps identify patterns that contribute to higher risk such as harsh driving events, overspeeding, and inconsistent driving behavior. With systems like Intangles’ driver behavior monitoring, fleets can move from reacting to incidents to identifying risk patterns early and coaching drivers before they escalate.
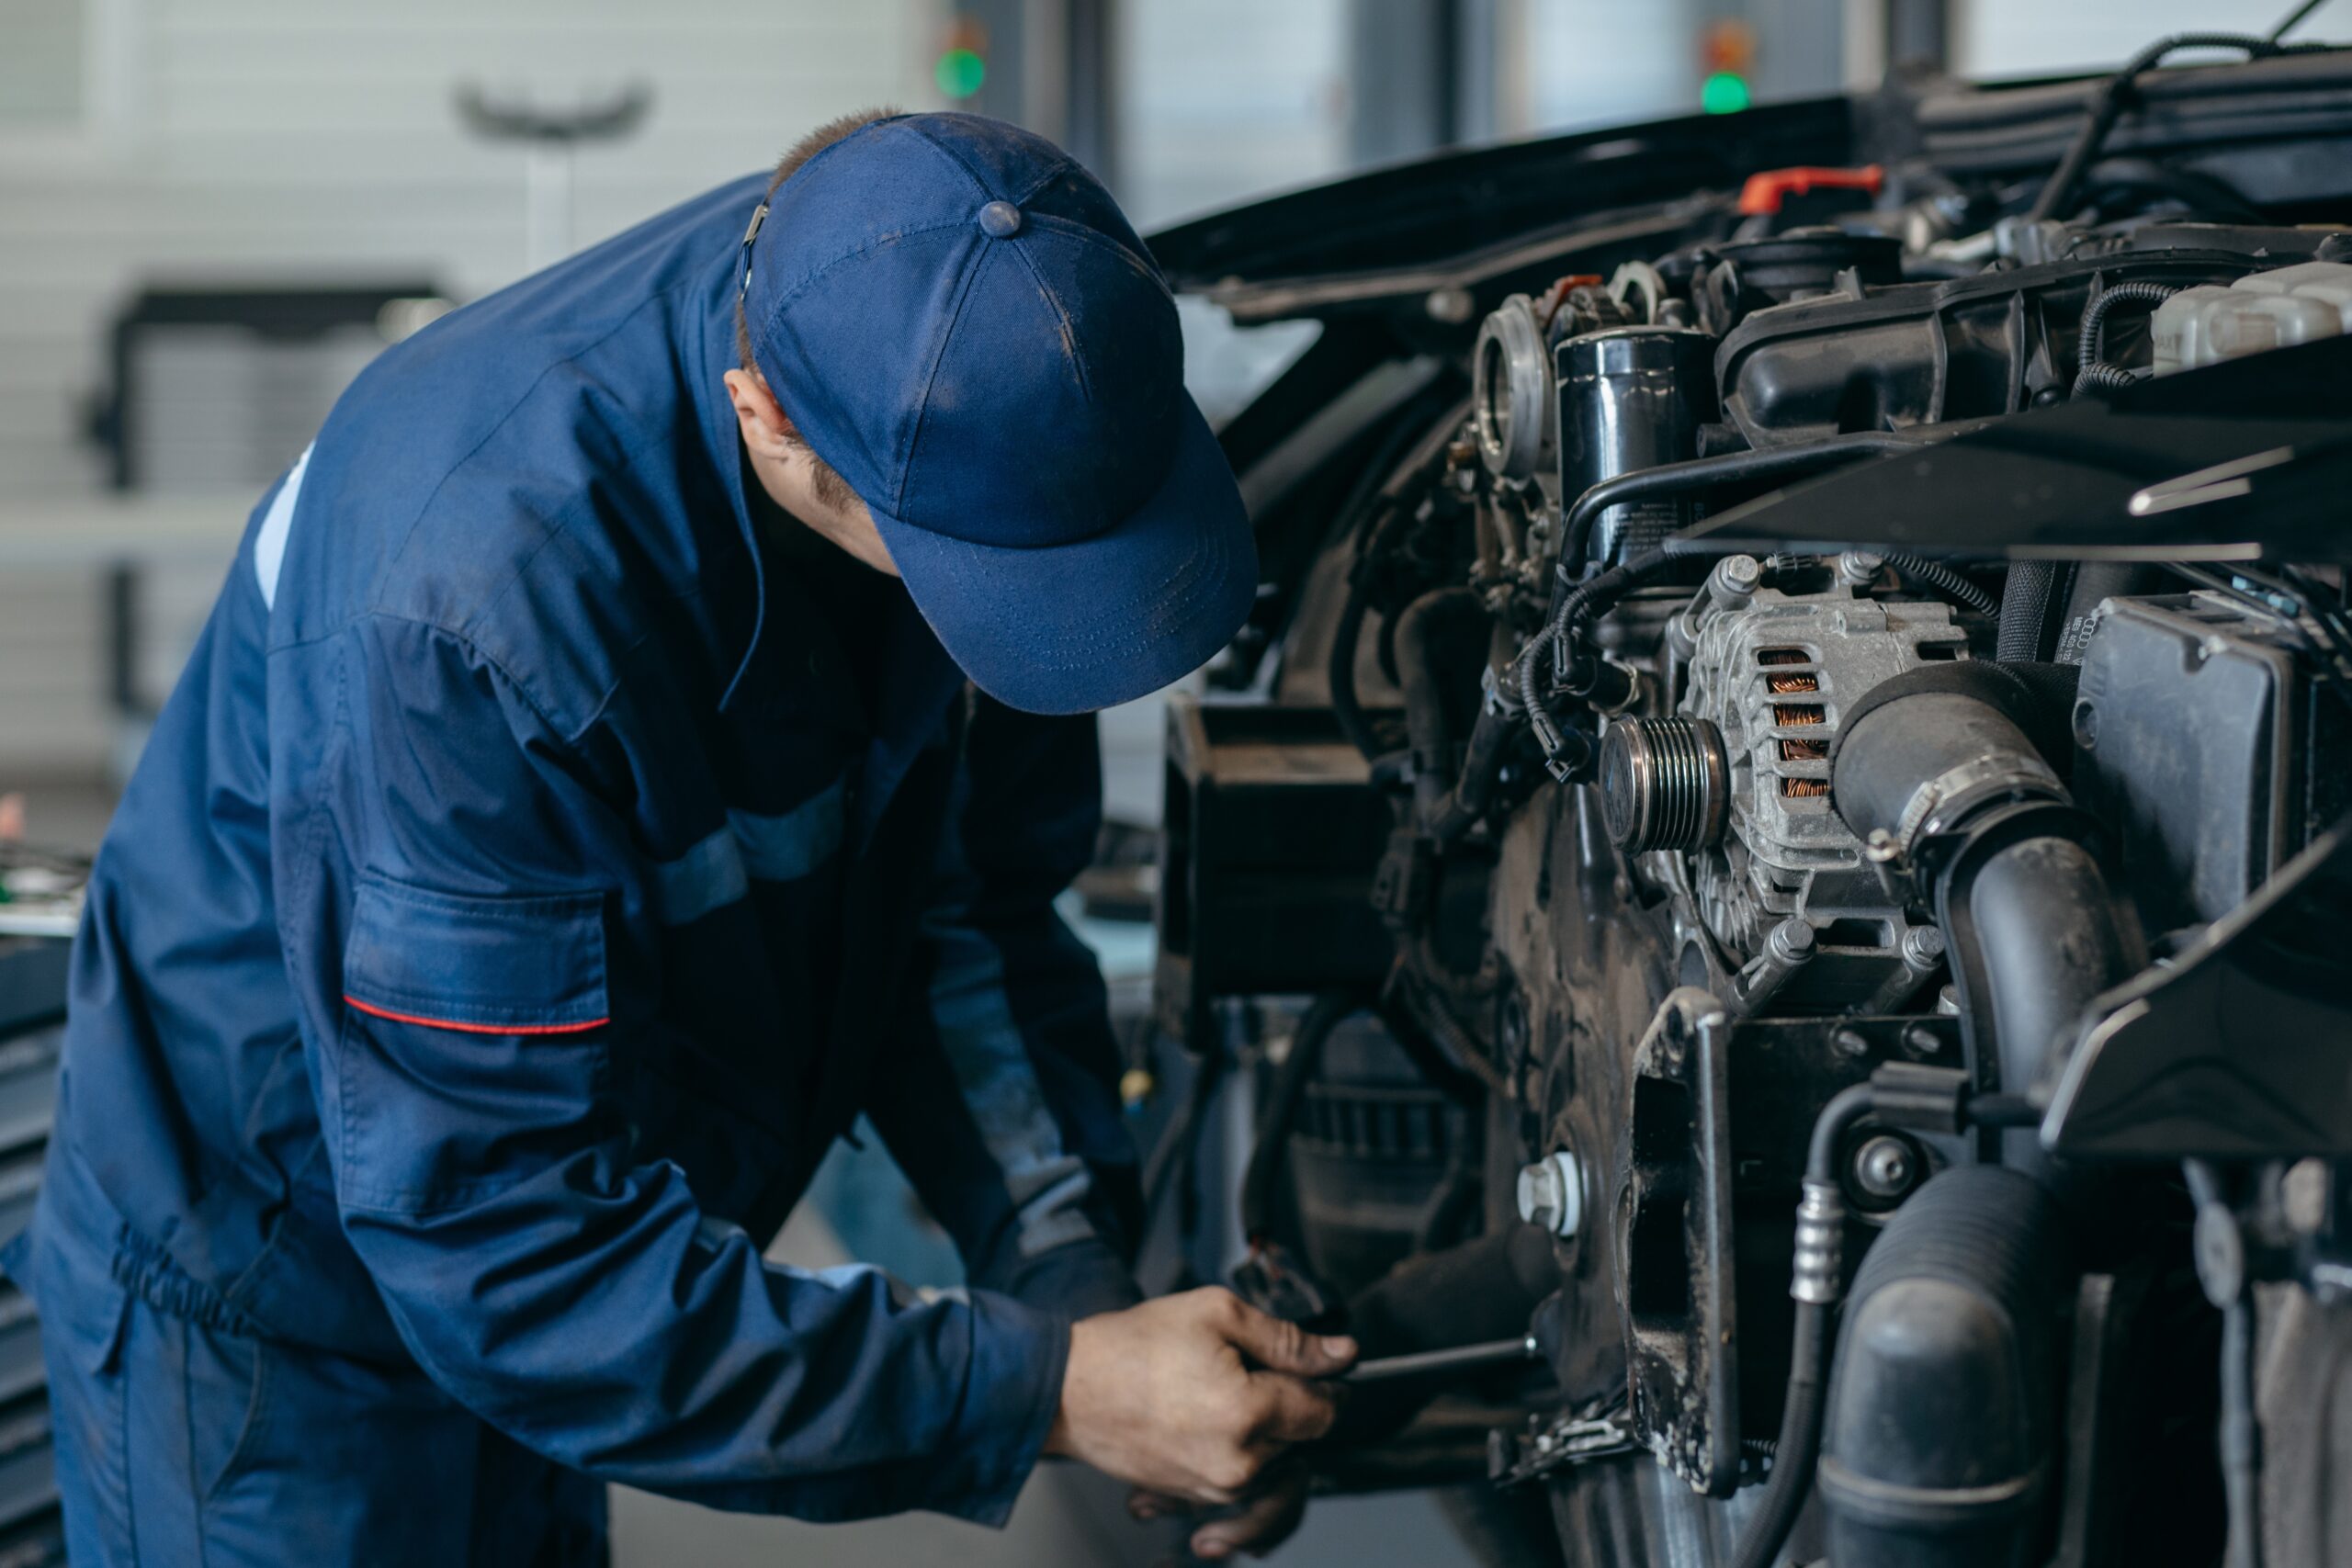
Predictive maintenance addresses the mechanical side of risk. Many accidents are linked to avoidable component failures that show early warning signals before breakdown. Identifying these signals in advance reduces both accident probability and unplanned downtime.
At the same time, insurance outcomes are increasingly tied to operational data. Fleets that can demonstrate improving safety trends, consistent driver performance, and proactive maintenance are better positioned during renewals. Telematics and operational data are no longer optional inputs—they are becoming standard expectations in underwriting decisions.
None of these systems eliminate risk entirely. But together, they shift fleet operations from reactive incident management to continuous risk reduction. Over time, this changes how costs behave across insurance, downtime, and operational disruption.
Most fleets already have enough data. The challenge is connecting it in a way that actually influences decisions.
That is where Intangles’ integrated platform brings everything together—driver behavior, vehicle health, and operational intelligence in one system. Instead of managing disconnected tools, fleets get a unified view of risk and performance across the entire operation.
In practice, this means fewer surprises, faster decisions, and more stable fleet performance over time.
Tracking alone solves one problem—visibility. But when it’s combined with geofencing and
Most fleets don’t struggle with a lack of data anymore. The real gap is in connecting that data and actually using it consistently.
Intangles’ platform instead of relying on separate tools for tracking, fuel monitoring, driver behavior, and maintenance, everything comes together in one place. Location data is no longer isolated—it’s connected with performance, efficiency, and predictive insights.
In practice, this means less manual coordination, faster response to issues, and a clearer understanding of what’s happening across the fleet. If you want to move beyond basic tracking and start using data to improve operations, take a closer look at the Intangles’ vehicle tracking solution or speak with our team today.
KNOW MORE
Frequently Asked Questions
What is the average cost of a fleet accident?
For medium to heavy commercial trucks, the average crash costs approximately $148,000 in direct expenses. When indirect costs are included, such as insurance increases, downtime, driver replacement, and administrative burden, the total is typically 3 to 10 times higher. The National Safety Council estimates the average economic cost of a fatal crash at $1.95 million.
How do fleet accidents affect insurance premiums?
A single at-fault accident can increase premiums at the next renewal, and that increase typically persists for 3 to 5 years. Commercial auto premiums across the industry have been rising 6 to 12% annually. Fleets with poor safety records may face even steeper increases or difficulty finding coverage.
How can fleets reduce accident-related costs?
The most effective approach combines driver behavior monitoring with predictive vehicle maintenance. Identifying high-risk drivers and coaching them before incidents occur reduces accident frequency. Maintaining vehicle health through predictive analytics prevents mechanical failures that contribute to crashes. Together, these measures can reduce at-fault accidents by 30% or more.


We’re looking forward to meeting you